CIE IGCSE Topical Past Paper 1
4.2 Costs, scale of production and break-even analysis
Table 4.1 Data for one of MHL’s factories | |
Output per month (units) | 200 000 |
Fixed costs per month | $500 000 |
Variable cost per unit | $25 |
(a) Define ‘average cost’.[2]
(b) Calculate total variable cost per month. Show your working. [2]
Working:
Table 2.1 Extract from CTF’s output data (children’s beds per month) | |
Break-even output | 14 000 |
Current level of output | 18 000 |
Maximum factory output | 25 000 |
(b) Calculate the margin of safety for CTF’s children’s beds. Show your working. [2]
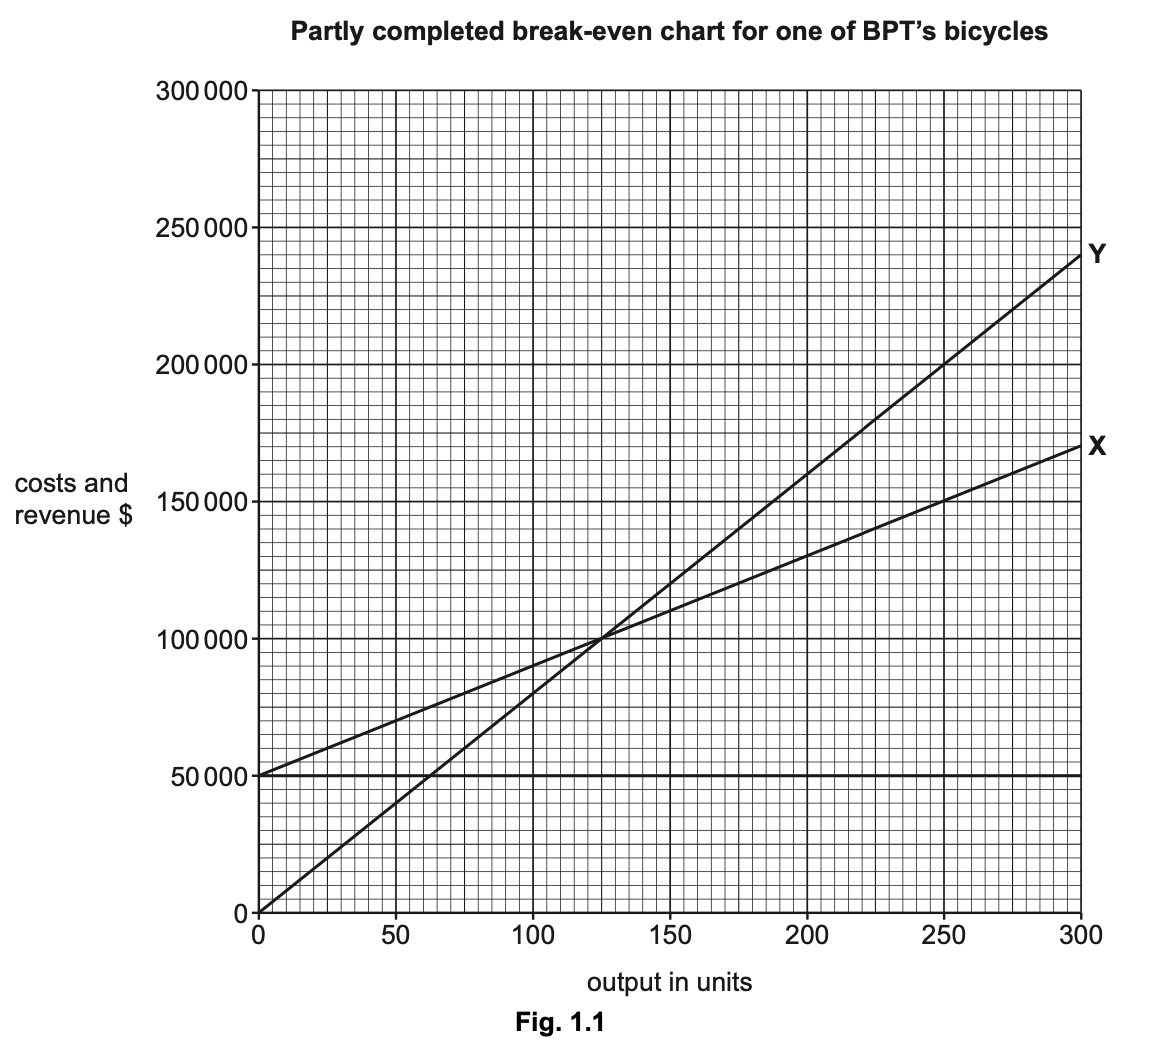
(a) Identify the lines labelled X and Y in Fig. 1.1. [2]
X:
Y:
(c) Outline two ways BPT could lower its break-even level of output.[4]
Way 1:
Way 2:
Table 2.1 Extract from CTF’s output data (children’s beds per month) | |
Break-even output | 14 000 |
Current level of output | 18 000 |
Maximum factory output | 25 000 |
(b) Calculate the margin of safety for CTF’s children’s beds. Show your working. [2]
Extract from FBM’s cost and output data | |
Variable costs per unit | $5000 |
Fixed costs per year | $600 000 |
Number of boats made each year | 300 |
(a) Define ‘diseconomies of scale’. [2]
(b) Identify two ways a business can use cost data to help make decisions. [2]
Way 1:
Way 2:
(c) Identify four fixed costs a business might have. [4]
Fixed cost 1:
Fixed cost 2:
Fixed cost 3:
Fixed cost 4:
Table 2.1 Extract from CTF’s output data (children’s beds per month) | |
Break-even output | 14 000 |
Current level of output | 18 000 |
Maximum factory output | 25 000 |
(b) Calculate the margin of safety for CTF’s children’s beds. Show your working. [2]
Extract from Suliman’s data for his existing business | |
Break-even output | 500 t-shirts |
Current sales | 550 t-shirts |
Selling price per t-shirt | $3.99 |
Variable cost per t-shirt | $1.99 |
(a) Define ‘break-even output’.. [2]
(b) Calculate the margin of safety. Show your working. [2]
Working:
Final answer:
Extract from Paolo’s financial and sales data | |
Average price per cake | $6 |
Average cost per cake | $4 |
Forecast average number of cake sales per day | 50 |
(b) Calculate the average revenue per day. Show your working. [2]